Circle Panic: Party Game Market Research
What if every mobile party game lives in the same corner of the map — and one corner is completely empty?
The Question
Where does a new mobile party game actually fit in a category that already includes Heads Up!, Spaceteam, and a wall of dare-card clones — and what would it cost to build it?
Perceptual Map
Plotting five direct competitors on two axes — where the game is played and how its content evolves — surfaces a clear pattern. Every incumbent clusters in the same quadrant. The opposite corner is unoccupied.
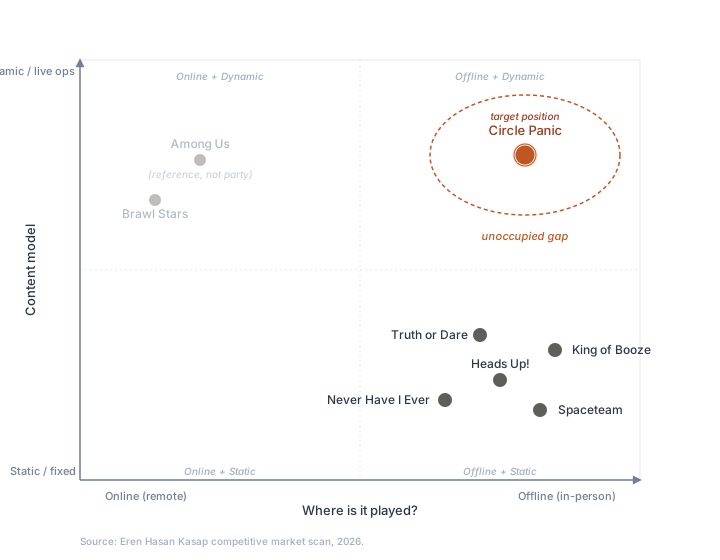
The vertical axis tracks how a product's content evolves — fixed decks vs. live-ops updates. The horizontal axis tracks where the game is actually played — remote vs. in-person.
Key Findings
Competitors cluster in the same quadrant: offline play with static, fixed content.
9-month studio cost (10 FTEs, USD). Most of it is non-engineering overhead — not product work.
Cost ratio between the studio scenario and a two-student out-of-pocket bootstrap. Even with opportunity cost included, the gap stays at ~10×.
What the Competitive Matrix Reveals
Across all five direct competitors — Heads Up!, Spaceteam, Truth or Dare, King of Booze, and Never Have I Ever — the same structural weakness appears: content runs out. Decks are finite, prompts repeat, and replayability decays after a handful of sessions. None of them have built a live-ops content engine, because doing so requires the kind of telemetry and player base typically associated with online competitive games — not casual party apps.
That mismatch is the real gap. Live-ops infrastructure has been optimized for online, hardcore audiences. Party games — which are inherently offline and casual — have been left with shipping a static product and hoping word-of-mouth carries it. A party game that ships offline-first but with dynamic, updatable content would occupy the empty quadrant.
The Cost Model
A bottoms-up model comparing two scenarios — a 9-month, fully-staffed studio versus two students bootstrapping the same product over 18 months. The model is built on USD averages from Glassdoor, Levels.fyi, and Indeed, with assumptions tagged in blue and formulas in black.
| Cost Category | Studio (C) | 2 Students (B) |
|---|---|---|
| Personnel (10 FTEs vs. 2 founders) | $840,000 | $0 |
| Infrastructure & Tools | $36,034 | $484 |
| Marketing & UA | $52,000 | $0 |
| Overhead (benefits, office, legal) | $258,750 | $2,200 |
| Total cost (respective timelines) | $1,186,784 | $2,684 |
The headline number isn't engineering cost — it's organizational overhead. Personnel, benefits, and office account for ~87% of the studio scenario. The implication: most of what a studio spends isn't building the product, it's running the company that builds it.
Deliverables
Method & Honest Limitations
- Competitor data was assembled from App Store metadata, public reviews, and third-party tracker estimates. Download numbers are given in brackets (e.g. “1–5M”) rather than point estimates because tracker accuracy varies by category.
- The cost model uses USA salary averages from Glassdoor, Levels.fyi, and Indeed. Adjusting for a Türkiye-based studio would reduce the studio total by roughly 40–60%, but the cost ratio between scenarios stays in the same order of magnitude.
- Studios don't publish their CapEx and OpEx for individual titles. The cost model is a structured estimate, not an audited figure. It is meant to make the gap between scenarios visible, not to predict any specific company's P&L.
- Circle Panic is a concept — not a shipped product. Its position on the perceptual map reflects design intent, not measured performance.